News and Views
August 2023
To be Successful the LSE must Strengthen the New Issue Market
The outcome of the CAB Payments initial public offer does not reflect well on the LSE’s ability to re-build confidence in London as a good centre for companies to launch their initial public offers. The shares in CAB Payments were sold to the public at 335p per share but immediately fell to a discount and are currently selling on a discount of more than 15% to the offer price.
Not only was the valuation of the company badly mis-judged but I discovered that having been allotted a small holding in the offer process I was unable to get a dealing price online through Interactive Investor, The Interactive website was still unable to provide a dealing price several days after dealings started in this share although live prices were available on competitor websites such as Hargreaves Lansdown.
If the City of London and the banks and brokers dealing with private investors are unable to improve their competence, in terms of issue pricing and technical efficiency, it is hardly surprising that companies such as WE Soda will seek other markets when considering a new listing.
February 2023 – Is the Market Cheap?
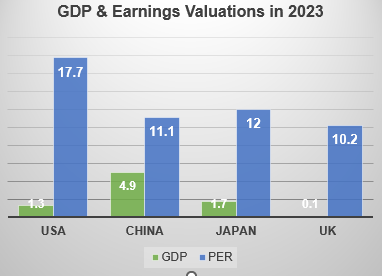
To test this assumption take a look at the chart on the right. This illustrates the variations in the estimated economic growth and the estimated price earnings ratios as between four leading G20 countries. The green bars indicate the estimated growth in GDP in 2023 and the blue bars the projected price earnings ratios on MSCI constituent shares in one year’s time.
One way of evaluating the comparative over or under valuation in each market is by measuring the difference between the values in each pair of bars. Needless to say, this is no more than a very rough approximation of relative valuations as the data inevitably employ somewhat subjective measures.
Bearing this caveat in mind, the ratio between the forward price earnings ratios and economic growth for China is 2.3 while that for the USA is 13.6 Japan is 7.1 and the UK a staggering 102. However, the value for the UK is misleading as the ratio may well be off the chart given that many experts are estimating negative UK economic growth in 2023. We shall follow this particular indicator with interest as the year progresses. It will be interesting to see if the Chinese and Japanese markets outperform the UK and the USA.
We welcome your contributions to this page. Please use the Contact form to send them to us.
STAR Barometer – October
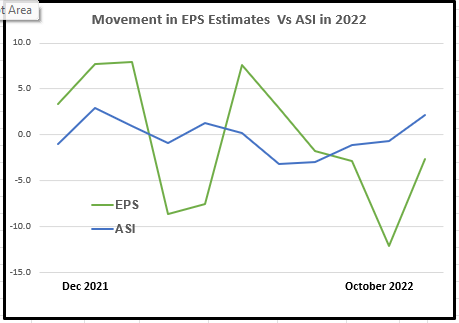
Following the extreme market turbulence that resulted from the impetuous and injudicious actions by Liz Truss and her Downing Street team at the end of September the beginning of the first week in October has seen a marginal improvement in the outlook for corporate earnings as shown by the green line on the chart opposite.
The blue line indicates an associated marginal improvement with a small recovery in the All Share index as at 3rd October 2022.
However, given the unstable fundamentals this recovery could well prove transient.
JPM October 2022
STAR Barometer – September
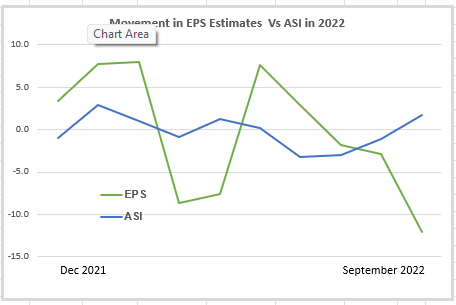
Our monthly STAR chart that illustrates the change in the direction of analysts’ earnings estimates over the next two years has recently taken a decidedly negative path.
The latest consensus data show earnings for the largest 450 main market shares falling back by just over 12% compared with the average of the previous three months. The comparison with the August chart, below, may indicate more bearish movements in the London share market this autumn.
JPM September 2022
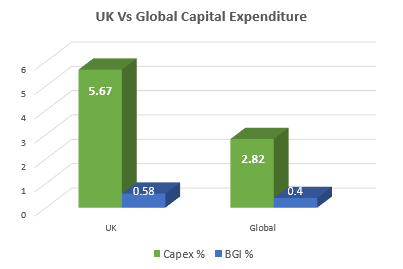
Corporate Capital Expenditure
The chart, on the right, compares the capital expenditure as a percentage of the market capitalisation, where applicable, for each of the 450 LSE main market listed companies on my database with the comparable returns for more than 200 of the largest global businesses. To my considerable surprise the CAPEX figure for UK-listed companies (represented by the green bars) appears to be almost exactly double that for the global cohort.
The BGI data (the blue columns) definitely needs a bit of explanation. BGI or Business Growth Indicator is a term that I coined many years ago as an attempt to indicate the possible growth in the future business of a company based on the historic rate of return on capital employed multiplied by the most recent reported capital expenditure expressed as a percentage of the total market capitalisation.
Clearly this is no more than an extremely rough indicator of the potential for future growth and does not include the important factor, in many fields, of the amount of money invested in research and development.
I guess the unexpectedly higher scores for London listed companies are due to the higher weighting, in the London market, of the very large mining and oil companies that inevitably have huge capital expenditure requirements. JPM August 2022
Introducing the STAR market barometer
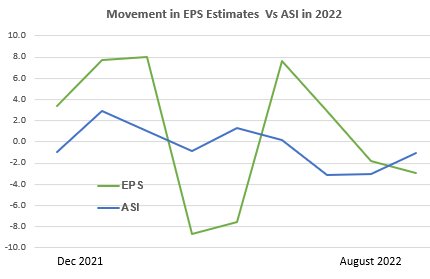
By October this year I will have been producing the STAR Newsletter every month for 30 years and for the past decade I have included, in the newsletter, charts that illustrate the movement in the consensus estimates of leading analysts relating to their expectations of the future trend in UK corporate earnings. The charts are derived from aggregated data provided by Sharescope that cover both historic and estimated forward earnings of the largest companies listed on the LSE main market.
The original aim of this exercise was to provide readers of the newsletter with a general indication of the changing trend in estimates month by month rather than the actual percentage movements per se as I have found these often tend to be over-optimistic
The chart, on the right, illustrates the percentage change, month by month, in earnings estimates for the largest 450 LSE main market listed companies (green line) compared with the monthly movement in the All Share Index (blue line) over the same period. The movement in earnings estimates has been calculated by comparing the estimated total earnings for the next full reporting year (Year 2) of all the companies covered with the comparable aggregated estimates over the previous 3 months. Similarly, the change in the ASI compares the most recent monthly value with the mean of the index values for each of the past three months.